
This post explains the solar parks in India map park by park. The map marks 27 solar parks under the Ministry of New and Renewable Energy’s (MNRE) Solar Park Scheme that have at least some capacity running. Together they have a park capacity of 27,545 MW, of which 21,338 MW was commissioned according to the Central Electricity Authority’s (CEA) status report of September 2026. Each park has a number on the map, and the same number is used in every table below, with its developer, district, state and capacity.
Questions on solar parks are usually of three kinds: match the park with its state, pick the largest park or the state with the most capacity, or explain why the parks are where they are. Park and commissioned capacities here come from the CEA “Status Report on Development of Solar Parks/UMREPPs in the Country”, September 2026. Scheme rules and dates come from the MNRE scheme page. The scheme’s total size depends on which official document you read and on what date, so the post gives all three totals side by side and says where each one comes from.
Solar Parks in India Map
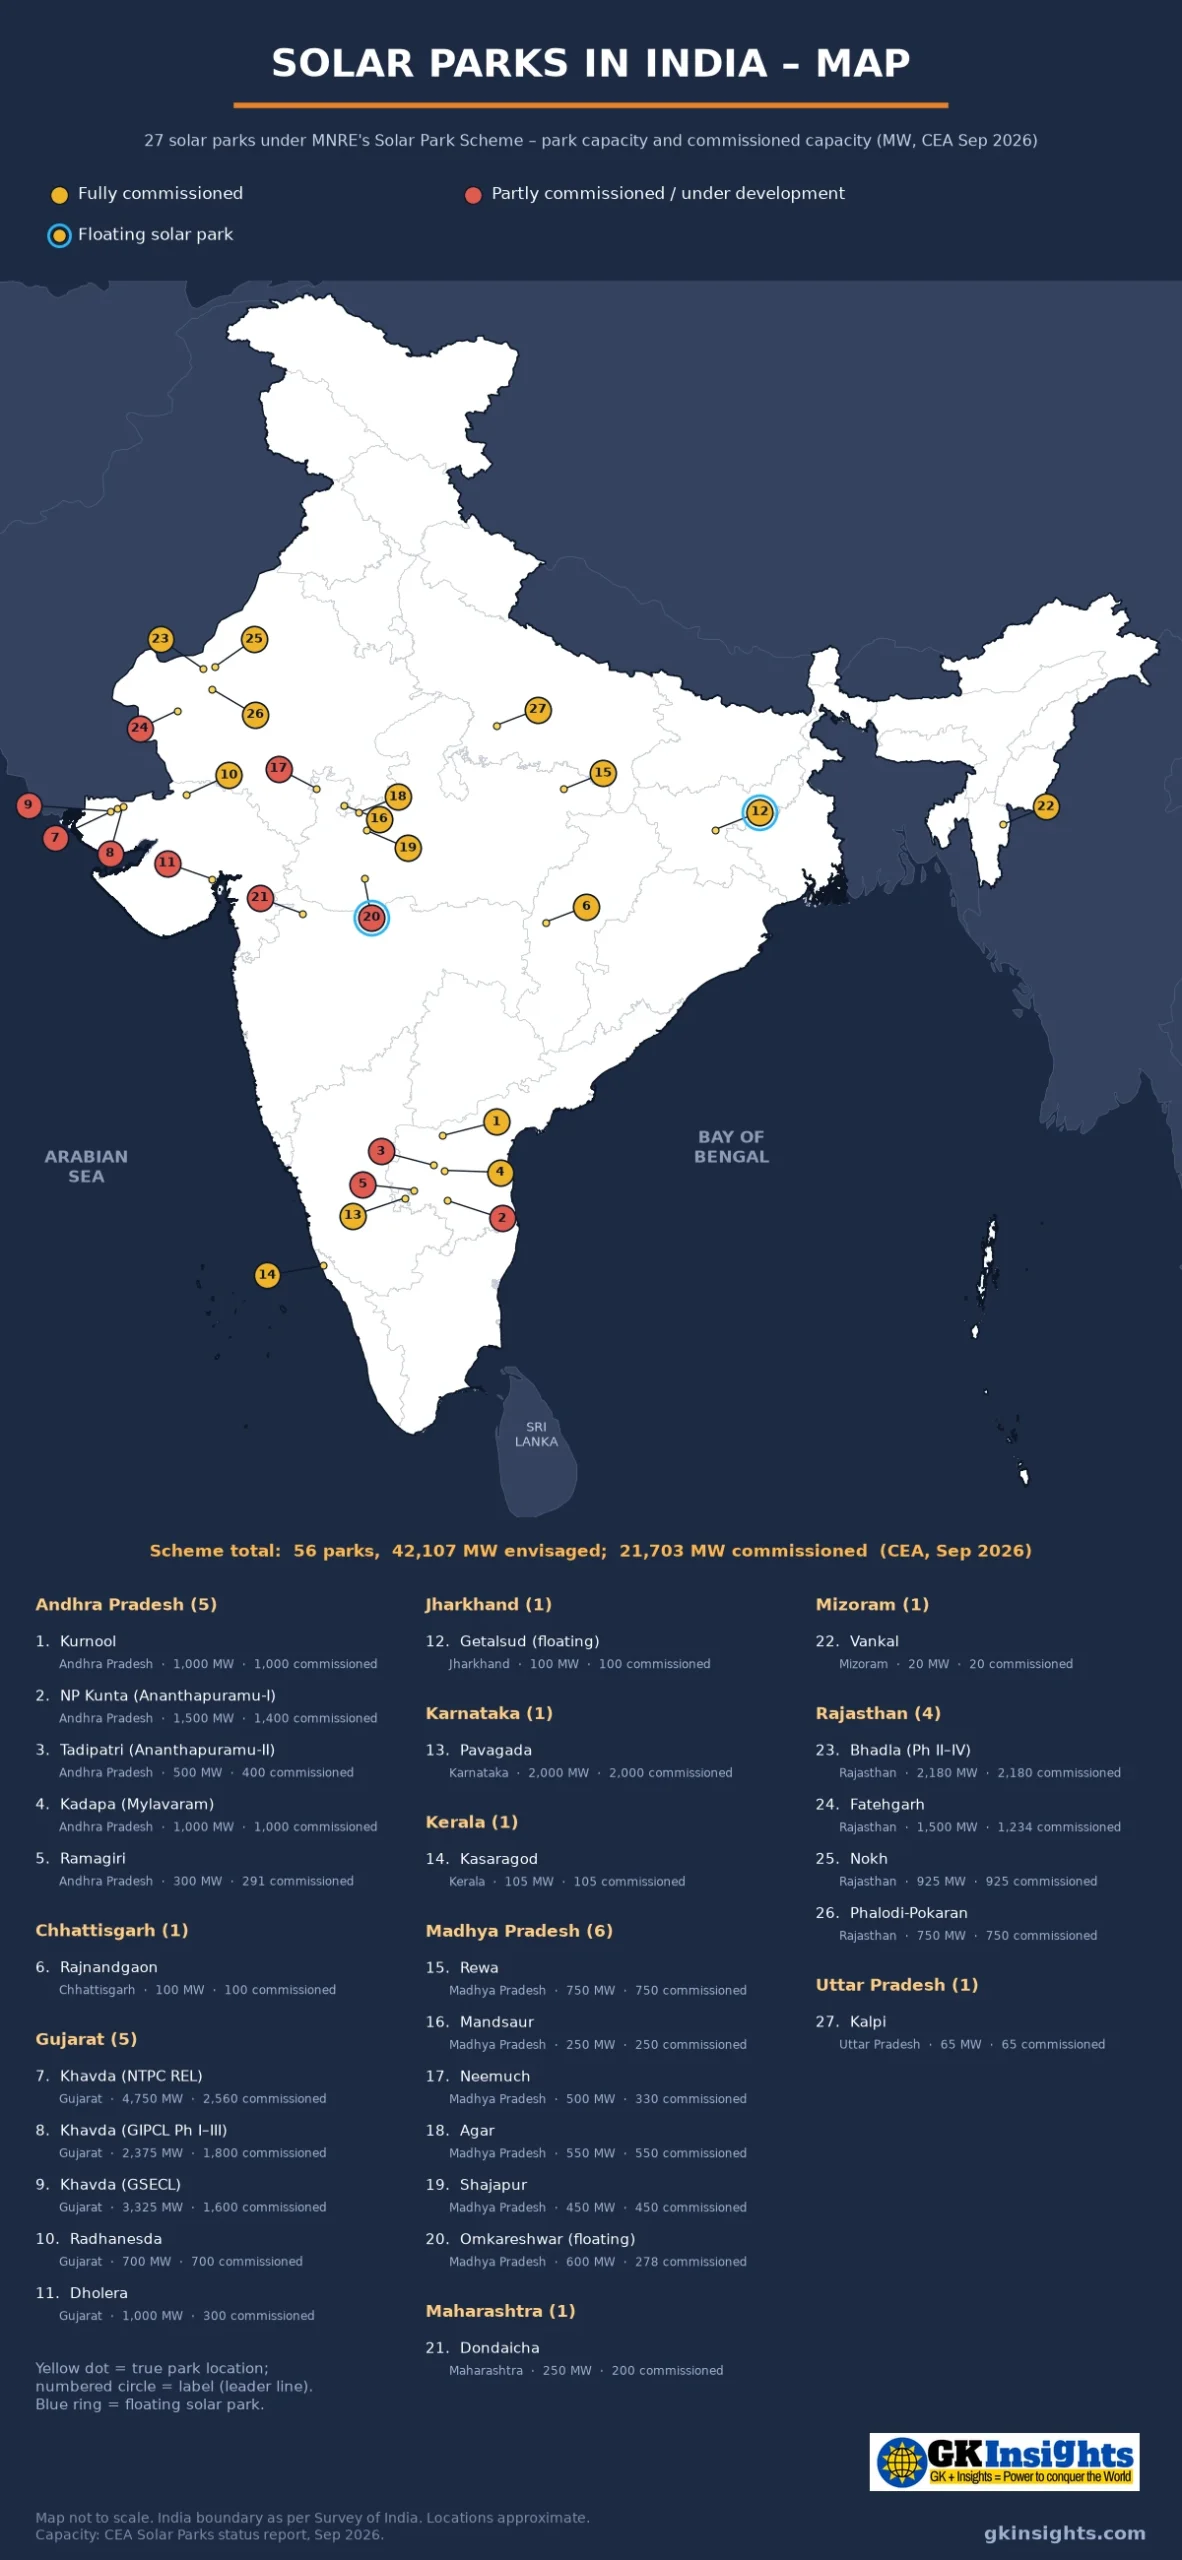
How to Read the Solar Parks in India Map
The numbers run state by state in alphabetical order, from Andhra Pradesh (1–5) to Uttar Pradesh (27), so parks of one state sit together in the key. The colour of each circle shows how far the park has got, as on the CEA report of September 2026:
- Yellow: fully commissioned (16 parks) – the whole park capacity has solar plants running
- Red: partly commissioned / under development (11 parks) – some plants are running and the rest are under construction or still to be awarded
- Blue ring: floating solar parks (12 and 20) – Getalsud in Jharkhand (fully commissioned) and Omkareshwar in Madhya Pradesh (partly commissioned), built on reservoirs instead of land
Each park’s true location is a small yellow dot, and its numbered circle is joined to the dot by a short line. Where parks sit very close together – the three Khavda parks in Kachchh (7–9), the Andhra–Karnataka group around Anantapur and Pavagada (1–5, 13), the western Rajasthan parks near Bhadla (23, 25, 26) and the four Malwa parks (16–19) – the circles are pulled further apart; the Khavda circles are fanned out over the sea. Phalodi-Pokaran (26) is two sites shown by one marker. Positions are approximate and the map is not to scale. The panel at the bottom of the map repeats the CEA scheme total (56 parks, 42,107 MW envisaged, 21,703 MW commissioned). Parks still at the tender stage, and the multi-site “UP Solar Park”, are not numbered; they are listed further down.
What Is a Solar Park?
MNRE defines a solar park as a large piece of land developed with common infrastructure – transmission lines and substations, roads, water, drainage and communication – and with all statutory clearances already taken. A company that wins a solar tender can then set up its plant on a plot inside the park without having to buy land or build its own line to the grid. The Lok Sabha reply of 22 July 2026 describes the same idea: the park developer provides land, power evacuation, roads and water so that project developers can “establish their projects efficiently and with minimal implementation challenges”.
Two different companies are involved in every park, and exam questions often mix them up:
- Solar Power Park Developer (SPPD): the agency that builds and runs the park itself. It may be a state agency, a joint venture of the state with the Solar Energy Corporation of India (SECI), a central public sector company such as NTPC, or a private firm. In the tables below the SPPD is the name in brackets after the park.
- Solar project developer: the company that wins a plot in the park through bidding and builds the actual solar plant. A single park can have many of them; Pavagada in Karnataka, for example, has ten developers listed by CEA, from Tata Power (400 MW) to KREDL (50 MW).
MNRE’s guidelines say a park should normally be 500 MW or larger. Smaller parks are allowed where contiguous land is hard to get because of difficult terrain or a shortage of non-agricultural land. That is why the map has small parks such as Vankal in Mizoram (20 MW) and Kalpi in Uttar Pradesh (65 MW) next to multi-gigawatt parks in Gujarat.
Solar Park Scheme: Timeline and Funding
The scheme’s full name is “Development of Solar Parks and Ultra Mega Solar Power Projects”. The table below gives its main dates from MNRE’s scheme page and its office memorandum of 17 September 2025.
| Date | What happened | Source |
|---|---|---|
| 12 December 2014 | Scheme rolled out: at least 25 solar parks and ultra mega solar power projects with a target of 20,000 MW, to be set up within five years from 2014–15 | MNRE scheme page |
| 21 March 2017 | Target raised from 20,000 MW to 40,000 MW; revised guidelines issued | MNRE scheme page |
| 2018, 2021, 2023 | Timeline extended by office memoranda of 2 July 2018, 2 March 2021 and 16 June 2023 (the 2023 order took the scheme to 31 March 2026) | MNRE OM, 17 Sep 2025 |
| 17 September 2025 | Timeline extended by three years to 31 March 2029 for completing ongoing parks and clearing committed liabilities, with no extra money; new sanctions only until 31 March 2026 | MNRE OM, 17 Sep 2025 |
So, as of November 2026, the scheme is in its completion phase: no new parks can be sanctioned under it, but parks already approved have until March 2029 to be finished. Read the dates from the MNRE office memorandum of 17 September 2025 rather than older news reports, which still give March 2026 as the end date.
Central Financial Assistance (CFA)
MNRE pays two kinds of central financial assistance under the scheme:
- For planning: up to ₹25 lakh per solar park to prepare the detailed project report (DPR), surveys and similar work.
- For infrastructure: up to ₹20 lakh per MW or 30% of the project cost, including the cost of grid connectivity, whichever is lower. It is released on reaching milestones laid down in the scheme. In the usual modes it is split as up to ₹12 lakh per MW for the park’s internal infrastructure (paid to the SPPD) and up to ₹8 lakh per MW for the external transmission line (paid to the central or state transmission utility).
MNRE lists eight modes for choosing the SPPD – for example a state agency or central PSU (Mode 1), a joint venture of a state agency and SECI (Mode 2), or a private developer (Mode 4). In Mode 6 a private developer builds the park without any MNRE assistance. Mode 7 covers renewable energy parks developed by SECI, where assistance is given only for external transmission.
How Many Solar Parks Are There in India? Three Official Totals
This is where many students and many websites get confused. Three government documents of 2026 give three different totals for the same scheme:
| Source and date | Parks | Capacity of parks (MW) | Commissioned (MW) | States |
|---|---|---|---|---|
| PIB backgrounder, 2 August 2026 (data as of February 2026) | 54 | 39,188 (sanctioned) | not given | 13, counting one inter-state park in Jharkhand and West Bengal |
| MNRE reply to Lok Sabha Starred Question 58, 22 July 2026 | 56 | 39,461 (sanctioned) | 18,919 | 14 |
| CEA status report, September 2026 | 56 | 42,107 (envisaged) | 21,703 | 12 (by park location) |
None of these is wrong; they measure slightly different things on different dates. MNRE and PIB count the capacity sanctioned by the ministry. CEA counts the capacity envisaged in each park as reported by the developers, and it splits that into 21,703 MW commissioned, 8,674 MW under construction and 11,155 MW under award or tendering. CEA’s preface says “as on 30th June 2026”, but several entries in the same report are dated as late as 2 October 2026, so its commissioned figure is more recent than MNRE’s 18,919 MW of July 2026.
Matching the state tables shows where part of the gap comes from. Gujarat’s Radhanesda Phase II (700 MW) was approved on 5 March 2026, after PIB’s February data. In Jharkhand, CEA lists the Tilaya floating park at 755 MW against 310 MW in its own park table, and adds a 228 MW floating park at Konar reservoir; together these explain the whole Jharkhand difference. In Andhra Pradesh, CEA still counts 100 MW at Ananthapuramu-I that, by its own note, MNRE has cancelled. The remaining differences in Madhya Pradesh, Maharashtra and Rajasthan are not explained in the documents.
For an exam answer, quote the figure together with its source: “56 solar parks of about 39.5 GW sanctioned in 14 states (MNRE, July 2026)” is safe for the scheme, and “about 21.7 GW commissioned in solar parks (CEA, September 2026)” is safe for what is running. This post’s map and tables use CEA throughout so that the numbers add up.
State-wise Solar Park Capacity in India
| State | Parks (PIB, Feb 2026) | Sanctioned MW (PIB, Feb 2026) | Park capacity MW (CEA, Sep 2026) | Commissioned MW (CEA, Sep 2026) | Map nos. |
|---|---|---|---|---|---|
| Gujarat | 7 | 12,150 | 12,850 | 6,960 | 7, 8, 9, 10, 11 |
| Rajasthan | 11 | 10,726 | 11,805 | 5,089 | 23, 24, 25, 26 |
| Andhra Pradesh | 5 | 4,200 | 4,300 | 4,091 | 1, 2, 3, 4, 5 |
| Madhya Pradesh | 9 | 4,208 | 4,530 | 2,608 | 15, 16, 17, 18, 19, 20 |
| Karnataka | 1 | 2,000 | 2,000 | 2,000 | 13 |
| Uttar Pradesh | 8 | 3,740 | 3,740 | 430 | 27 |
| Maharashtra | 4 | 1,105 | 1,150 | 200 | 21 |
| Kerala | 3 | 255 | 255 | 105 | 14 |
| Chhattisgarh | 1 | 100 | 100 | 100 | 6 |
| Jharkhand | 3* | 644* | 1,317 | 100 | 12 |
| Mizoram | 1 | 20 | 20 | 20 | 22 |
| Odisha | 1 | 40 | 40 | 0 | – |
| Total | 54 | 39,188 | 42,107 | 21,703 | 27 parks |
* PIB shows Jharkhand as 2 parks (334 MW) plus one inter-state floating park in Jharkhand and West Bengal (310 MW); they are added together here. Uttar Pradesh’s 430 MW commissioned is Kalpi (27, 65 MW) plus the 365 MW multi-site UP Solar Park, which is not on the map.
On CEA’s commissioned figures, Gujarat (6,960 MW), Rajasthan (5,089 MW) and Andhra Pradesh (4,091 MW) together account for about 74% of the solar park capacity running in India. Gujarat also has the most capacity still to come: it has 5,890 MW of park capacity not yet commissioned, 4,490 MW of it in the three Khavda parks.
List of Solar Parks in India with Capacity
This list of solar parks in India follows the map numbers. “Park capacity” is the total capacity of the park in CEA’s list; “Commissioned” is the capacity of solar plants actually running in it, as given project by project in the same CEA report (September 2026). The SPPD is the agency that develops the park. Old district names are given as CEA writes them, with the present district in brackets where it has changed.
Andhra Pradesh, Karnataka and Kerala Solar Parks (1–5, 13, 14)
| No. | Solar park and park developer (SPPD) | Location, district, state | Park capacity (MW) | Commissioned (MW) | Notes for exams |
|---|---|---|---|---|---|
| 1 | Kurnool Ultra Mega Solar Park SPPD: APSPCL (NREDCAP, APGENCO, SECI JV) | Panyam mandal, Kurnool (now Nandyal), Andhra Pradesh | 1,000 | 1,000 | Fully commissioned. CEA lists four plant developers, including Greenko (SunEdison, 500 MW) and SBG Cleantech (350 MW). |
| 2 | Ananthapuramu-I Ultra Mega Solar Park SPPD: APSPCL | NP Kunta, Ananthapuramu (now Sri Sathya Sai), Andhra Pradesh | 1,500 | 1,400 | 1,400 MW running. CEA notes that the balance 100 MW of park capacity was cancelled by MNRE. Park area about 5,846 acres. |
| 3 | Ananthapuramu-II Ultra Mega Solar Park SPPD: APSPCL | Tadipatri mandal, Ananthapuramu district, Andhra Pradesh | 500 | 400 | 400 MW running, the remaining 100 MW re-allotted to APGENCO in January 2024. |
| 4 | Kadapa Ultra Mega Solar Park SPPD: APSPCL | Mylavaram mandal, YSR Kadapa district, Andhra Pradesh | 1,000 | 1,000 | 250 MW by NTPC and 750 MW by SECI; fully commissioned. |
| 5 | Ramagiri Solar Park SPPD: SECI | Ramagiri, Sri Sathya Sai district, Andhra Pradesh | 300 | 291 | 291.15 MW commissioned on 3 September 2026, with the last 8.5 MW expected by 15 October 2026 (CEA). |
| 13 | Pavagada Solar Park SPPD: KSPDCL (KREDL, SECI JV) | Pavagada, Tumakuru district, Karnataka | 2,000 | 2,000 | Fully commissioned on about 12,937 acres; ten plant developers, Tata Power (400 MW) the biggest. CEA’s note says “2050 MW”, but its park and commissioned figures are 2,000 MW. |
| 14 | Kasaragod Solar Park (Phase I) SPPD: RPCKL (KSEB, SECI JV) | Ambalathara / Nellithadam, Kasaragod district, Kerala | 105 | 105 | Phase I, fully commissioned; a 100 MW Phase II is under tendering. |
Five of the 27 parks are in the Rayalaseema region of Andhra Pradesh and one is just across the border at Pavagada in Karnataka. Together they have 6,091 MW running. This part of the Deccan plateau is dry and has large areas of non-agricultural land.
Gujarat Solar Parks (7–11)
| No. | Solar park and park developer (SPPD) | Location, district, state | Park capacity (MW) | Commissioned (MW) | Notes for exams |
|---|---|---|---|---|---|
| 7 | NTPC REL Khavda 4750 MW Solar Park SPPD: NTPC Renewable Energy | Khavda, Kachchh district, Gujarat | 4,750 | 2,560 | In the Rann of Kachchh; 2,560 MW running in CEA’s project table (its text note says 2,755 MW for the North Block). 1,720 MW is still to be awarded. |
| 8 | GIPCL RE Park Phases I-III SPPD: GIPCL | Khavda, Rann of Kutch, Kachchh district, Gujarat | 2,375 | 1,800 | Three GIPCL parks taken together: Phase I (600 MW) and Phase II (1,200 MW) running, Phase III (575 MW) under construction. |
| 9 | GSECL RE Park SPPD: GSECL | Khavda, Kachchh district, Gujarat | 3,325 | 1,600 | 1,600 MW running and 1,725 MW under construction; plant developers include NHPC, SJVN, NTPC REL, NLC India, KPI Green and SAEL. |
| 10 | Radhanesda Solar Park (Phase I) SPPD: GPCL | Radhanesda, Banaskantha district, Gujarat | 700 | 700 | Phase I fully commissioned; a 700 MW Phase II with SECI as developer was approved on 5 March 2026 and is under tendering. |
| 11 | Dholera Solar Park Ph-I SPPD: GPCL | Dholera / Mahadevpura, Ahmedabad district, Gujarat | 1,000 | 300 | Phase I of 1,000 MW: 300 MW running (Tata Power), 700 MW under construction. |
The three Khavda parks (7, 8, 9) have a combined park capacity of 10,450 MW, of which 5,960 MW was running in September 2026. On CEA’s list, the NTPC Renewable Energy park at Khavda has the largest park capacity of any single park in the scheme (4,750 MW), so it is the safest answer when a question asks for the largest solar park in India under the scheme.
Rajasthan Solar Parks (23–26)
| No. | Solar park and park developer (SPPD) | Location, district, state | Park capacity (MW) | Commissioned (MW) | Notes for exams |
|---|---|---|---|---|---|
| 23 | Bhadla Solar Park Phases II-IV SPPD: RSDCL / SUCRL / AREPRL | Bhadla, Jodhpur (now Phalodi), Rajasthan | 2,180 | 2,180 | Three parks taken together: Phase II (680 MW, RSDCL), Phase III (1,000 MW, SUCRL) and Phase IV (500 MW, AREPRL); all fully commissioned on about 13,830 acres. |
| 24 | Fatehgarh Solar Park Phase-IB SPPD: AREPRL (Adani-Rajasthan JV) | Fatehgarh, Jaisalmer district, Rajasthan | 1,500 | 1,234 | Phase IB of 1,500 MW: 1,234 MW running, 266 MW under construction. |
| 25 | Nokh Solar Park SPPD: RSDCL | Nokh, Jaisalmer district, Rajasthan | 925 | 925 | Fully commissioned by 18 December 2025; 735 MW by NTPC REL and 190 MW by Rising Sun. |
| 26 | Phalodi-Pokaran Solar Park SPPD: ESUCRL (Rajasthan-Essel JV) | Phalodi (400 MW) & Pokaran (350 MW), Phalodi / Jaisalmer, Rajasthan | 750 | 750 | Two sites, Phalodi (400 MW) and Pokaran (350 MW), under one park; fully commissioned. |
PIB’s August 2026 backgrounder gives Bhadla an installed capacity of 2,245 MW over nearly 5,700 hectares (56 sq km), developed in phases from 2015 to 2020. The CEA list has 2,180 MW for Phases II–IV. The 65 MW difference is most likely Bhadla Phase I, a state-owned park that is not in CEA’s list. PIB also notes that the lowest solar tariff of that time, ₹2.44 per unit, was discovered in a 2017 auction at Bhadla.
Madhya Pradesh Solar Parks (15–20)
| No. | Solar park and park developer (SPPD) | Location, district, state | Park capacity (MW) | Commissioned (MW) | Notes for exams |
|---|---|---|---|---|---|
| 15 | Rewa Ultra Mega Solar Park SPPD: RUMSL (MPUVN, SECI JV) | Gurh, Rewa district, Madhya Pradesh | 750 | 750 | Fully commissioned by 3 January 2020 on about 3,929 acres; three developers of 250 MW each (Mahindra, ACME and Arinsun). |
| 16 | Mandsaur Solar Park SPPD: RUMSL | Suwasra, Mandsaur district, Madhya Pradesh | 250 | 250 | Fully commissioned; plants built by NTPC Renewable Energy. |
| 17 | Neemuch Solar Park SPPD: RUMSL | Neemuch district, Madhya Pradesh | 500 | 330 | 330 MW running, 170 MW under construction. |
| 18 | Agar Solar Park SPPD: RUMSL | Susner, Agar Malwa district, Madhya Pradesh | 550 | 550 | Fully commissioned. |
| 19 | Shajapur Solar Park SPPD: RUMSL | Shajapur district, Madhya Pradesh | 450 | 450 | Fully commissioned. |
| 20 | Omkareshwar Floating Solar Park SPPD: RUMSL | Omkareshwar reservoir, Khandwa district, Madhya Pradesh | 600 | 278 | Floating park on the Omkareshwar reservoir on the Narmada; 278 MW running (NHDC 88, Amp Energy 100, SJVN 90), 322 MW still to be awarded. CEA’s park table gives the park as 518 MW, its project table 600 MW. |
All six Madhya Pradesh parks are developed by Rewa Ultra Mega Solar Ltd (RUMSL), a joint venture of the Madhya Pradesh Urja Vikas Nigam and SECI. Four of them (16–19) are on the Malwa plateau in the west of the state.
Other States: Chhattisgarh, Jharkhand, Maharashtra, Mizoram and Uttar Pradesh (6, 12, 21, 22, 27)
| No. | Solar park and park developer (SPPD) | Location, district, state | Park capacity (MW) | Commissioned (MW) | Notes for exams |
|---|---|---|---|---|---|
| 6 | Rajnandgaon Solar Park SPPD: SECI | Rajnandgaon district, Chhattisgarh | 100 | 100 | 100 MW (160 MWp) of solar with a 40 MW / 120 MWh battery energy storage system, built by Tata Power Solar; completed February 2024. |
| 12 | SECI Getalsud Floating Solar Park SPPD: SECI | Getalsud Dam, Ranchi district, Jharkhand | 100 | 100 | Floating park on the Getalsud reservoir near Ranchi, built by L&T; the last 50 MW was commissioned on 2 October 2026 (CEA). |
| 21 | Dondaicha Solar Park SPPD: MAHAGENCO | Methi & Vikharan, Dhule district, Maharashtra | 250 | 200 | 200 MW running, 50 MW under construction. |
| 22 | Vankal Solar Park SPPD: Power & Electricity Dept, Mizoram | Vankal, Khawzawl district, Mizoram | 20 | 20 | The smallest park on the map and the only one in the North-East. |
| 27 | Kalpi Solar Park SPPD: BSUL (NHPC-UPNEDA JV) | Parasan, Jalaun district, Uttar Pradesh | 65 | 65 | Near Kalpi town; commissioned March 2024. |
Largest Solar Parks in India on the CEA List
“Which is the largest solar park in India?” has more than one answer, depending on whether you count the planned size of a park or the capacity already running, and whether you treat Bhadla’s phases as one park or three. The comparisons below use only the CEA report of September 2026. Press reports often call one park or another “the world’s largest”; such claims are not repeated here because they change as new projects come up.
| Rank | By park capacity (MW) | Rank | By capacity commissioned (MW) |
|---|---|---|---|
| 1 | Khavda (NTPC REL) (7) – 4,750 | 1 | Khavda (NTPC REL) (7) – 2,560 |
| 2 | Khavda (GSECL) (9) – 3,325 | 2 | Bhadla (Ph II-IV) (23) – 2,180 |
| 3 | Khavda (GIPCL Ph I-III) (8) – 2,375 | 3 | Pavagada (13) – 2,000 |
| 4 | Bhadla (Ph II-IV) (23) – 2,180 | 4 | Khavda (GIPCL Ph I-III) (8) – 1,800 |
| 5 | Pavagada (13) – 2,000 | 5 | Khavda (GSECL) (9) – 1,600 |
Note that GIPCL Khavda (8) and Bhadla (23) are each three parks added together. Counted as a single park, the largest fully commissioned park in the list is Pavagada in Karnataka (2,000 MW), followed by Bhadla Phase III (1,000 MW) and the Kurnool and Kadapa parks (1,000 MW each). Two Rajasthan parks still at an early stage – the RRVUNL park at Ramsar and the Bodana park – are planned at 2,000 MW each.
PIB’s backgrounder names Bhadla, Pavagada and Rewa as examples of large solar projects. Rewa is smaller (750 MW) but is a common exam name because it was one of the first parks approved, on 1 December 2014, and was fully commissioned by January 2020.
Khavda: What the Solar Parks in India Map Shows and What It Does Not
Khavda in the Rann of Kachchh appears in the news as a giant renewable energy park, and news reports quote much larger capacities for it than the map shows. Those larger figures refer to the wider renewable energy zone, which includes private projects and wind–solar hybrid plants outside the Solar Park Scheme. Only three parks there are on CEA’s scheme list: NTPC Renewable Energy (7, 4,750 MW), GIPCL Phases I–III (8, 2,375 MW) and GSECL (9, 3,325 MW). The map shows only these three. If a question asks about the Solar Park Scheme, these are the figures to use; for the wider Khavda zone, give the source and date of whatever number you quote.
Khavda is close to the international border, on flat, salty land of the Rann that is of little use for farming. The CEA report says the NTPC park alone has 23,750 acres of land.
Floating Solar Parks in India
Floating solar plants sit on pontoons on reservoirs. They do not need farmland, the water cools the panels, and the panels reduce evaporation from the reservoir. Two floating parks on the map are running:
- Getalsud (12), Jharkhand: 100 MW on the Getalsud reservoir near Ranchi, developed by SECI.
- Omkareshwar (20), Madhya Pradesh: on the Omkareshwar reservoir on the Narmada in Khandwa district, with 278 MW running out of a planned 600 MW.
Four more floating parks are in CEA’s list but not yet running: the DVC floating parks at Tilaya (755 MW) and Maithon (234 MW, partly in West Bengal), a 228 MW park at Konar reservoir in Jharkhand, and a 50 MW NHPC park at West Kallada in Kerala.
Floating solar now has a scheme of its own. On 31 July 2026 the government approved the Pradhan Mantri Surya Sarovar Yojana (PM-SSY) to support 5,000 MW of floating solar with co-located energy storage of at least two hours (10,000 MWh), with an outlay of ₹5,070 crore from 2026–27 to 2030–31. PIB cites an assessment by the National Institute of Solar Energy (NISE) that puts India’s floating solar potential at about 102.18 GWp. For the dams themselves, see the hydro power plants in India map and the lakes in India map.
Why Solar Parks Are Located Where They Are
Look at the solar parks in India map again and most of the circles fall in a band from western Rajasthan and Kachchh through Malwa to the Rayalaseema–Pavagada area. Four things decide where a park can come up:
- Sunshine and dry weather: a solar plant earns money only when the sun shines. The Thar desert, Kachchh and the rain-shadow parts of the Deccan have many clear days and low rainfall, so the same panel produces more power there than in cloudy, wet areas. The climate of India explains why these areas are dry.
- Cheap, flat, non-agricultural land: a 1,000 MW park needs several thousand acres. CEA’s land figures make this clear: about 12,937 acres for Pavagada’s 2,000 MW and about 13,830 acres for Bhadla’s 2,180 MW. Desert, salt flats and rocky uplands are easier to acquire than irrigated farmland.
- Transmission: a park is useless without a line to carry the power out. Parks are planned with pooling substations and links to the inter-state grid; PIB notes that the Green Energy Corridor programme had enabled the evacuation of 24,567.8 MW of renewable energy by February 2026.
- Water bodies for floating parks: Getalsud, Omkareshwar, Tilaya, Maithon and Konar are all reservoirs of existing dams, which saves land and uses the dam’s grid connection.
Compare this with the thermal power plants in India map, where plants cluster near coalfields, ports and big cities, and the nuclear power plants in India map, where cooling water decides the site. Solar parks go where the land and the sunshine are, which is often far from the cities that use the power – so transmission matters more for them than for most other kinds of power plant.
Solar Parks Under Development (Not on the Map)
The parks below are in CEA’s September 2026 list but had no capacity running, so they are not numbered on the map. Questions on new parks are common in current affairs, so it helps to know at least their states.
| Park | State | Capacity (MW) | Status (CEA, Sep 2026) |
|---|---|---|---|
| Pugal Phases I–III (RSDCL) | Rajasthan (Bikaner) | 2,450 | Under award / tendering |
| RRVUNL park, Ramsar (Pugal tehsil) | Rajasthan (Bikaner) | 2,000 | Awarded, under construction (810 MW to NLC India; MoU with Coal India for 1,190 MW) |
| Bodana | Rajasthan | 2,000 | Under award / tendering |
| Radhanesda Phase II (SECI) | Gujarat (Banaskantha) | 700 | Under award / tendering |
| Jalaun (BSUL) | Uttar Pradesh | 1,200 | Under award / tendering |
| Chitrakoot, Lalitpur, Jhansi (TUSCO) | Uttar Pradesh | 800 + 600 + 600 | Awarded, under construction |
| Kanpur Dehat and Kanpur Nagar | Uttar Pradesh | 75 + 35 | Under award / tendering |
| Morena Phase I and Dhar | Madhya Pradesh | 600 + 200 | Morena under tendering; Dhar awarded |
| Barethi (NTPC REL) | Madhya Pradesh | 630 | Under award / tendering |
| Sai Guru (Sakri, Dhule) | Maharashtra | 500 | Matter under arbitration |
| Patoda and Aurangabad | Maharashtra | 250 + 150 | Patoda under construction; Aurangabad under tendering |
| Tilaya and Maithon floating (DVC–NTPC JV) | Jharkhand (Maithon partly West Bengal) | 755 + 234 | Under construction (445 MW at Tilaya still to be awarded) |
| Konar floating (DVC) | Jharkhand | 228 | Under award / tendering |
| West Kallada floating (NHPC) | Kerala | 50 | Under construction |
| Kasaragod Phase II | Kerala | 100 | Under award / tendering |
| Landehill, Ganjam (NHPC) | Odisha | 40 | Under construction |
Uttar Pradesh is a good example of a state where the scheme is only now taking off: CEA shows 3,740 MW of park capacity there but only 430 MW running. Rajasthan, on the other hand, has the largest amount of capacity under award or tendering of any state (4,450 MW).
Solar Parks in the Bigger Picture
Solar parks are only one part of India’s solar capacity. MNRE’s Lok Sabha reply of 22 July 2026 puts the country’s total installed solar capacity at 162.15 GW as on 30 June 2026 – 125.60 GW of utility-scale plants, 30.11 GW of rooftop and 6.43 GW off-grid – up from 2.82 GW in 2013–14. The same reply cites IRENA’s Renewable Energy Capacity Statistics 2026 for India being third in the world in installed solar capacity.
Set against MNRE’s 18,919 MW running in solar parks, that means roughly one in seven megawatts of utility-scale solar is inside a scheme park. Most large solar plants are now built outside the scheme, on land arranged by developers or states, and connected to the inter-state grid. CEA’s preface gives India’s total renewable energy capacity, excluding large hydro, as 247.18 GW at the end of September 2026.
Exam Traps on Solar Parks in India
These are the mix-ups that come up again and again in Prelims-style questions:
- Scheme totals: 54 parks / 39,188 MW (PIB, Feb 2026), 56 parks / 39,461 MW (MNRE, July 2026) and 56 parks / 42,107 MW (CEA, Sep 2026) are all official. Always say whose figure and which date.
- Sanctioned vs commissioned: 39–42 GW is the size of the parks; only about 19–22 GW was running in 2026.
- Target: 20,000 MW when the scheme began in December 2014, raised to 40,000 MW in March 2017. Do not confuse it with the National Solar Mission’s much larger national targets.
- Deadline: no new sanctions after 31 March 2026; ongoing parks to be completed by 31 March 2029 (MNRE OM, 17 September 2025).
- Pavagada is in Tumakuru district of Karnataka, although it is almost surrounded by Andhra Pradesh.
- Rewa Ultra Mega Solar Ltd (RUMSL) develops all six Madhya Pradesh parks, not only Rewa – including the Omkareshwar floating park.
- Kurnool and Ananthapuramu are Andhra Pradesh parks developed by APSPCL, a joint venture of NREDCAP, APGENCO and SECI. Ananthapuramu-I is at NP Kunta, Ananthapuramu-II at Tadipatri.
- Khavda: only the NTPC, GIPCL and GSECL parks are in the Solar Park Scheme; the wider renewable energy zone is larger and includes private projects.
- Bhadla is in the Thar desert in Rajasthan (CEA writes Jodhpur district; the area is now in the new Phalodi district). Its scheme phases are II, III and IV.
- Floating parks: Getalsud (Jharkhand) and Omkareshwar (Madhya Pradesh) are running; Tilaya, Maithon, Konar and West Kallada are not yet running.
- Only North-East park: Vankal in Mizoram (20 MW).
Solar Parks in India: Quick Revision Table
| Asked as | Answer |
|---|---|
| Scheme launched | 12 December 2014 (MNRE) |
| Original and revised target | 20,000 MW; raised to 40,000 MW on 21 March 2017 |
| Minimum park size | 500 MW (smaller allowed in difficult terrain or where land is short) |
| CFA for infrastructure | Up to ₹20 lakh/MW or 30% of project cost, whichever is lower |
| Parks sanctioned (MNRE, 22 July 2026) | 56 parks, 39,461 MW, 14 states |
| Commissioned in parks (CEA, Sep 2026) | 21,703 MW |
| Largest park capacity in the CEA list | NTPC REL Khavda, Gujarat (4,750 MW) |
| Largest single fully commissioned park | Pavagada, Karnataka (2,000 MW) |
| State with most commissioned park capacity | Gujarat (6,960 MW, CEA) |
| Running floating solar parks | Getalsud (Jharkhand), Omkareshwar (Madhya Pradesh) |
| Park with battery storage on the map | Rajnandgaon, Chhattisgarh (40 MW / 120 MWh) |
| Smallest park on the map | Vankal, Mizoram (20 MW) |
| Last date for new sanctions / completion | 31 March 2026 / 31 March 2029 |
UPSC Practice Points on Solar Parks in India
These points sum up the facts most likely to be asked in Prelims and State PSC papers. Read them with the solar parks in India map open beside you.
- Solar park = land plus common infrastructure (transmission, roads, water) with clearances, built by an SPPD for many plant developers.
- Scheme: launched December 2014 (20 GW), raised to 40 GW in March 2017; new sanctions closed 31 March 2026, completion by 31 March 2029.
- Totals: 56 parks, 39,461 MW sanctioned, 18,919 MW running (MNRE, July 2026); 42,107 MW envisaged, 21,703 MW running (CEA, Sep 2026).
- Biggest states by running park capacity (CEA): Gujarat, Rajasthan, Andhra Pradesh, Madhya Pradesh, Karnataka.
- Clusters: Khavda (Kachchh), Bhadla–Nokh–Phalodi (Thar), Rayalaseema–Pavagada (Deccan), Malwa (MP).
- Floating solar: Getalsud and Omkareshwar running; PM Surya Sarovar Yojana (July 2026) for 5,000 MW floating solar with storage.
- For the full list of solar parks in India and their capacities, use the tables above; for the largest solar park in India, say whether you mean park capacity (NTPC REL Khavda) or a single fully commissioned park (Pavagada).
- Revise with the hydro power plants in India map, the thermal power plants in India map and the plateaus of India map (for the Malwa and Deccan sites).
FAQs on Solar Parks in India Map
How many solar parks are there in India?
MNRE told the Lok Sabha on 22 July 2026 that 56 solar parks with a capacity of 39,461 MW have been sanctioned in 14 states, with 18,919 MW commissioned. CEA’s September 2026 report also lists 56 parks but gives 42,107 MW envisaged and 21,703 MW commissioned. A PIB backgrounder of August 2026, using February 2026 data, gives 54 parks and 39,188 MW. The solar parks in India map shows the 27 parks that had capacity running in September 2026.
Which is the largest solar park in India?
On CEA’s September 2026 list, the NTPC Renewable Energy park at Khavda in Gujarat has the largest park capacity (4,750 MW), with 2,560 MW running. The largest single park that is fully commissioned is Pavagada in Karnataka (2,000 MW). Bhadla in Rajasthan, counted as one complex, has 2,245 MW according to PIB.
What is the Solar Park Scheme?
It is MNRE’s scheme for “Development of Solar Parks and Ultra Mega Solar Power Projects”, rolled out on 12 December 2014. It helps states and agencies develop land with transmission, roads and water so that solar developers can set up plants quickly. MNRE gives up to ₹25 lakh per park for the DPR and up to ₹20 lakh per MW or 30% of project cost, whichever is lower, for infrastructure.
What is the target of the Solar Park Scheme?
The scheme began with a target of 20,000 MW and at least 25 parks. On 21 March 2017 the target was raised to 40,000 MW. Under MNRE’s order of 17 September 2025, no new parks can be sanctioned after 31 March 2026, and ongoing parks must be completed by 31 March 2029.
Which state has the most solar park capacity in India?
Gujarat. CEA’s September 2026 report gives it 12,850 MW of park capacity and 6,960 MW commissioned, mostly in the Khavda parks of Kachchh. Rajasthan is second with 11,805 MW of park capacity and 5,089 MW commissioned.
Which are the floating solar parks in India?
Two floating parks under the scheme are running: Getalsud (100 MW) near Ranchi in Jharkhand and Omkareshwar (278 MW of a planned 600 MW) on the Narmada in Madhya Pradesh. Floating parks at Tilaya, Maithon and Konar (DVC) and West Kallada (NHPC) are under development. The PM Surya Sarovar Yojana, approved on 31 July 2026, supports 5,000 MW of floating solar with storage.
Is the whole Khavda renewable energy park part of the Solar Park Scheme?
No. Only three Khavda parks are on CEA’s scheme list: NTPC Renewable Energy (4,750 MW), GIPCL Phases I–III (2,375 MW) and GSECL (3,325 MW). The much larger figures quoted for Khavda include private and hybrid projects outside the scheme.
What do the numbers on the solar parks in India map show?
They mark 27 solar parks in alphabetical order of state, from Andhra Pradesh (1–5) to Uttar Pradesh (27). Colours show whether a park is fully commissioned or partly commissioned, and the two floating parks (12 and 20) are marked separately. The same numbers are used in the tables.
Also Check:
– Hydro Power Plants in India Map
– Thermal Power Plants in India Map
– Nuclear Power Plants in India Map
– Oil Refineries in India Map
– Minerals in India Map
– Plateaus of India Map
– Lakes in India Map
Sources: CEA, Status Report on Development of Solar Parks/UMREPPs, September 2026 (CEA reports page); MNRE reply to Lok Sabha Starred Question 58, 22 July 2026; PIB backgrounder “India’s Solar Growth Enters a New Era”, 2 August 2026; MNRE Solar Park Scheme page; MNRE office memorandum, 17 September 2025.