
An overview of Indian Economy
This is the opening unit of the JAIIB course, and it gives you an overview of Indian Economy. It doesn’t ask you to memorise many numbers. What it asks is that you understand how India’s economy got to where it is today. Every later unit builds on this story.
Part of the JAIIB 2026 course · See JAIIB IE&IFS all units
1An overview of Indian Economy: Evolution
| Phase | Period | Main feature |
|---|---|---|
| Pre-British | Before colonial rule | Self-sufficient villages, agriculture plus strong handicrafts and trade |
| Colonial | British rule up to 1947 | Raw-material exporter and a market for British goods |
| Planned, state-led | 1951 to 1991 | Five-Year Plans, public sector dominance, licensing, bank nationalisation |
| Liberalised | 1991 onwards | LPG reforms, a growing private sector, global integration |
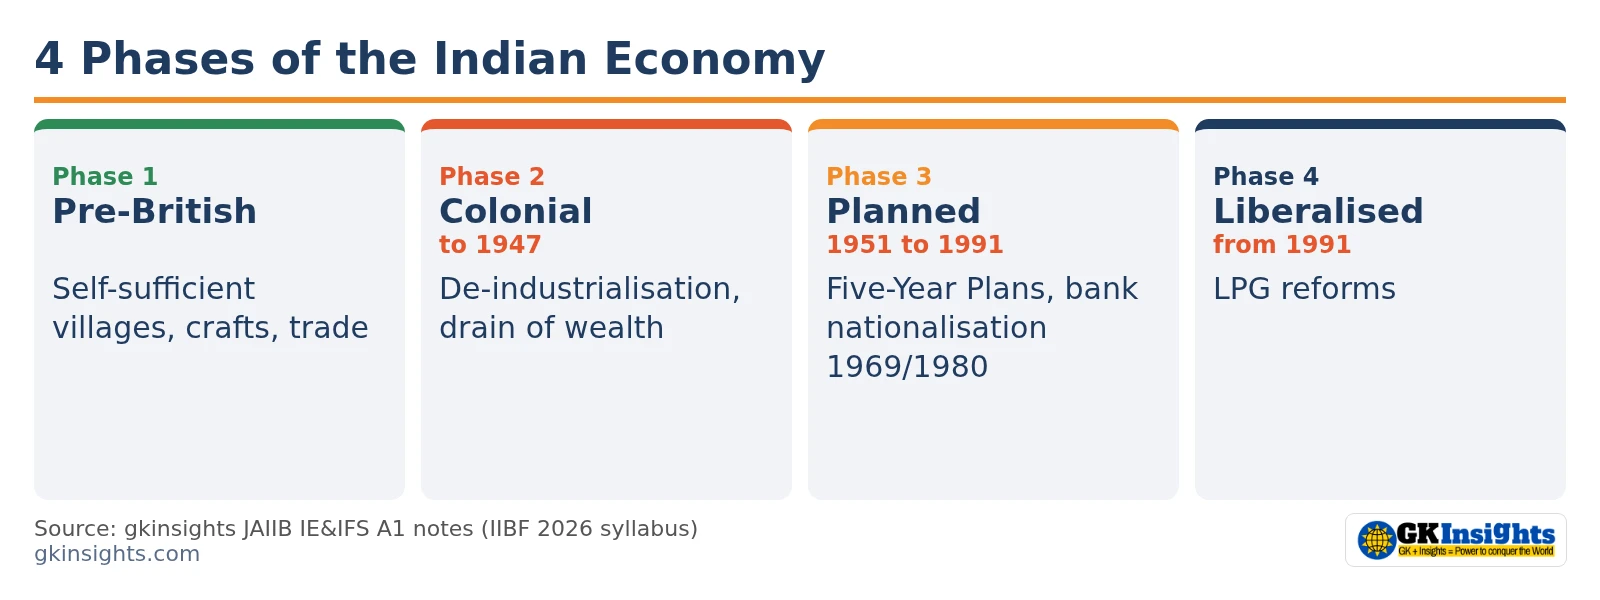
Key milestones after Independence
- 1950: The Planning Commission is set up.
- 1951–56: First Five-Year Plan.
- 1969: 14 major banks are nationalised, followed by 6 more in 1980.
- 1991: A BoP crisis leads to the New Economic Policy (LPG).
- 2015: NITI Aayog replaces the Planning Commission (1 January 2015).
- 2016–17: IBC (2016) and GST (1 July 2017).
2Basic Characteristics of Indian Economy
A mixed economy
In this overview of Indian Economy, note that both the public and private sectors play a role. The government owns some enterprises and regulates the rest.
A developing, fast-growing economy
| Indicator (base 2022-23) | 2024-25 | 2025-26 (PE) |
|---|---|---|
| Real GDP growth | 7.2% | 7.8% |
| Nominal GDP | ₹317.99 lakh crore | ₹345.37 lakh crore |
| Per capita GDP, at current prices | ₹2,25,833 | ₹2,43,107 |
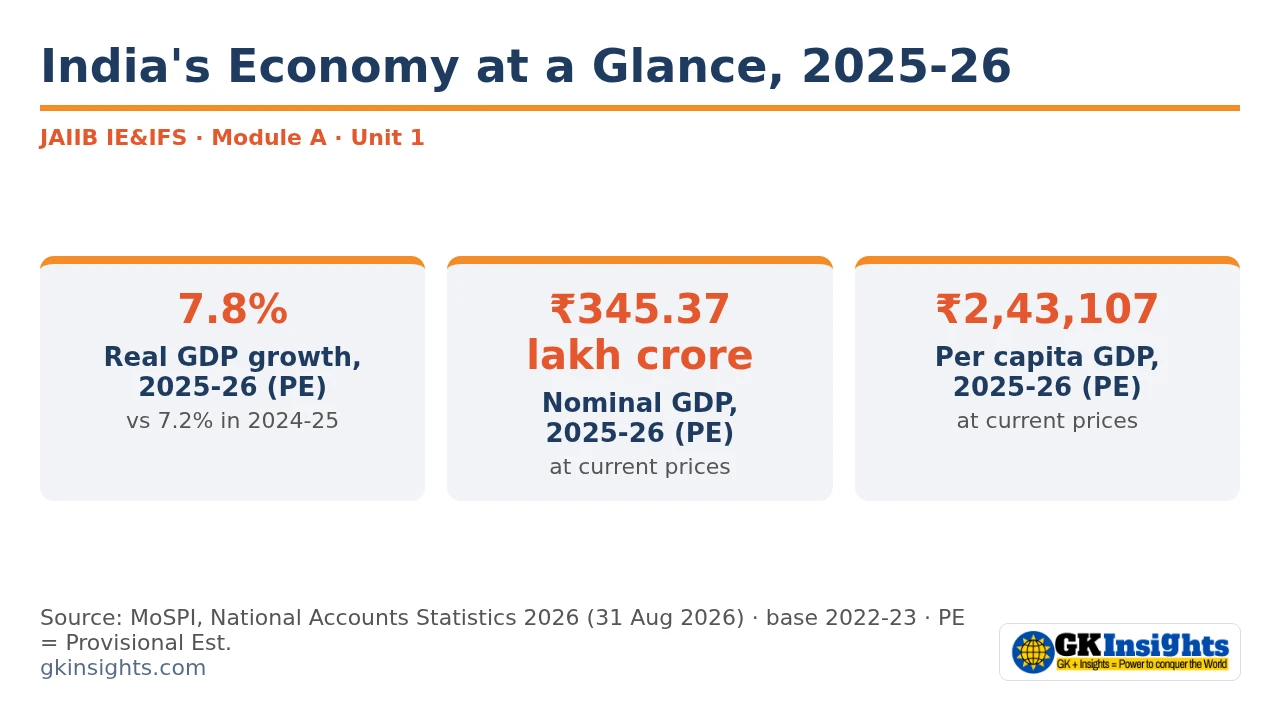
Source: MoSPI, National Accounts Statistics 2026 (released 31 August 2026), Statement 8.17.1: updated Provisional Estimates for 2025-26.
Services lead output, but farming employs many people
Services make up more than half of value added. Agriculture’s share of output is under one-fifth, yet agriculture still employs a large part of the workforce.
Other features
- A large, young population (the demographic dividend)
- A large unorganised sector
- Regional and income inequalities
- A growing role for digital payments and formal finance
3Indian Economy in Pre-British period
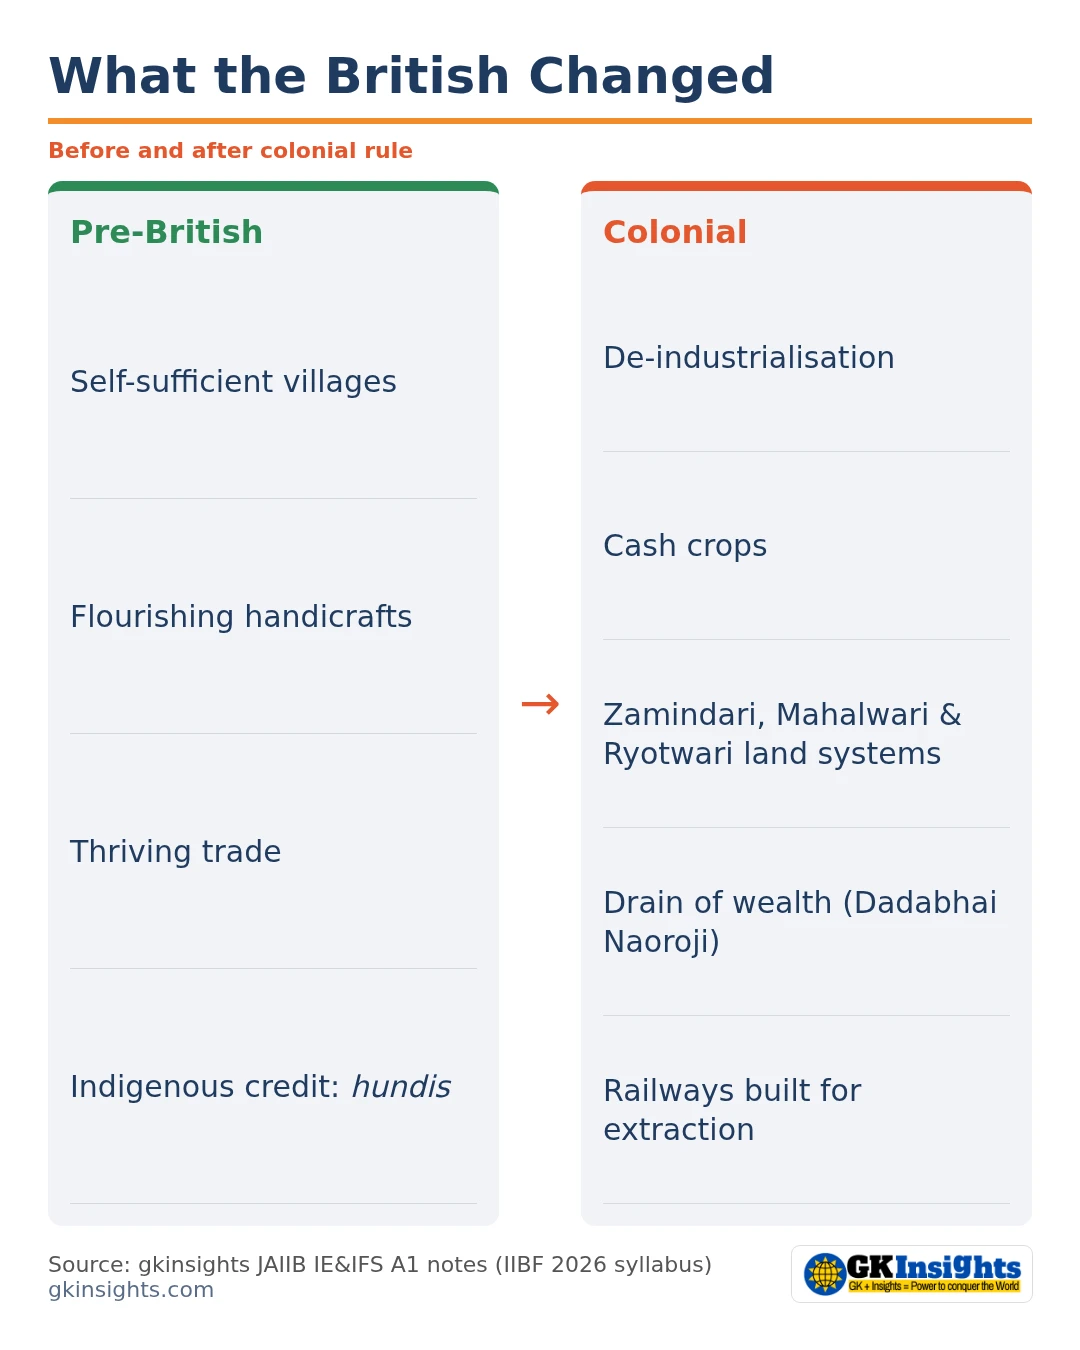
- Self-sufficient villages met most local needs.
- Agriculture was the main occupation.
- Handicrafts and textiles were known worldwide.
- Trade with West Asia, Southeast Asia and Europe.
- Indigenous credit: moneylenders and bankers, using instruments such as hundis.
What changed under British rule
| Policy effect | What it means |
|---|---|
| De-industrialisation | Handicrafts declined against cheap British machine-made goods |
| Commercialisation of agriculture | A shift to cash crops for export, at the cost of food crops |
| Land revenue systems | Zamindari, Mahalwari and Ryotwari systems burdened cultivators |
| Drain of wealth | Resources flowed to Britain without an equivalent return (Dadabhai Naoroji) |
| Railways and ports | Built mainly to move raw materials out and British goods in |
4Economy till 2008 & after 2008
1951 to 1980: slow, planned growth
- Five-Year Plans, heavy industry and the public sector
- Licence raj and import substitution
- Modest growth, often called the “Hindu rate of growth”
- Bank nationalisation (1969, 1980)
1980 to 1991: early opening and a crisis
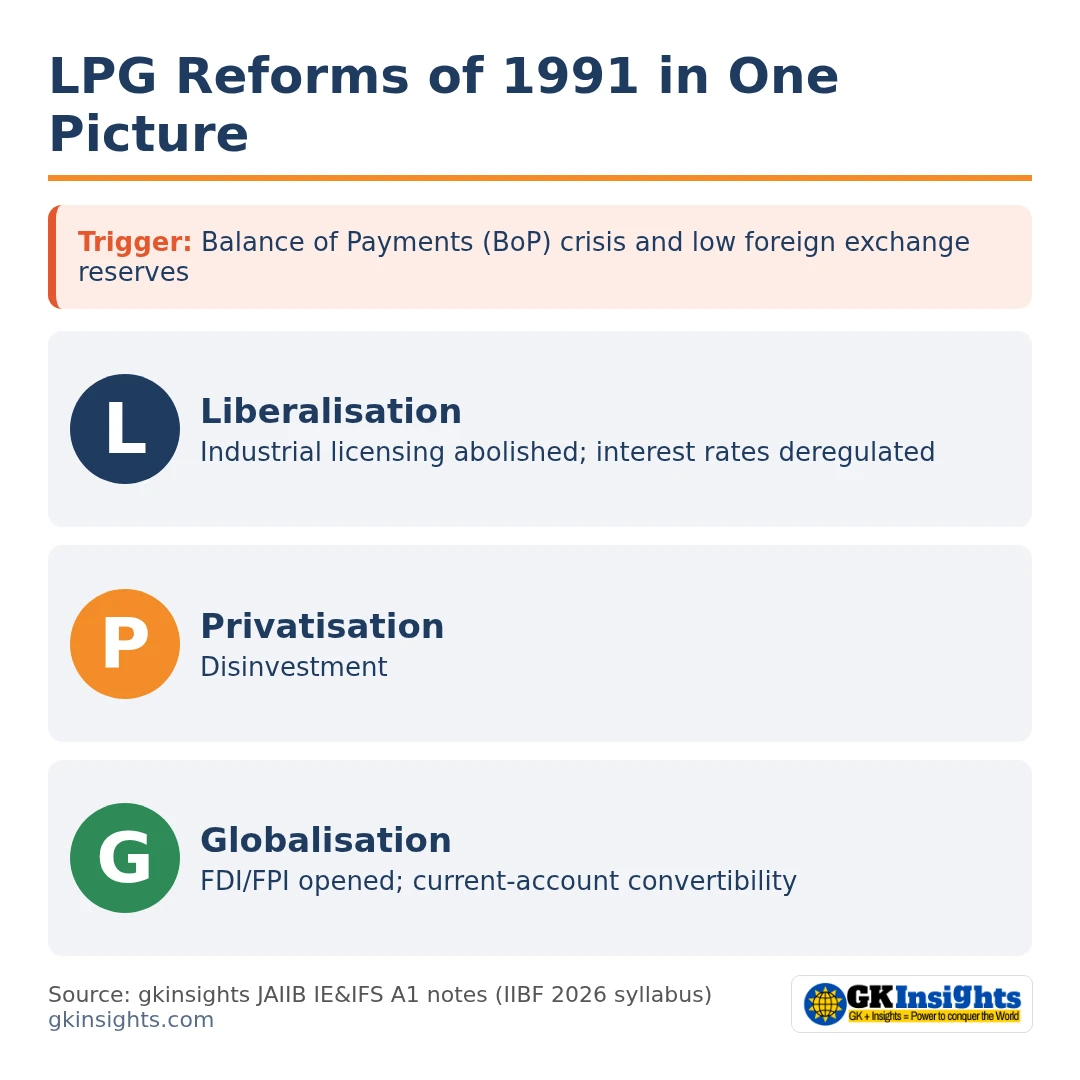
Some liberalisation took place in the 1980s. Rising fiscal deficits and external borrowing led to the 1991 BoP crisis, when forex reserves fell to very low levels.
1991 to 2008: the reform years
| Pillar | Examples |
|---|---|
| Liberalisation | Most licensing abolished, interest rates deregulated, trade barriers reduced |
| Privatisation | PSU disinvestment, private entry into reserved sectors |
| Globalisation | FDI and FPI opened up, current-account convertibility |
After 2008
- Global Financial Crisis (Lehman Brothers, September 2008): India responded with fiscal stimulus and monetary easing.
- Reforms: IBC (2016), demonetisation (November 2016), GST (July 2017), flexible inflation targeting.
- COVID-19: The economy contracted in 2020-21, then rebounded.
- Recent years: growth of 7.2% in 2024-25 and 7.8% (PE) in 2025-26.
5Structural changes in Indian Economy
Structural change means a shift in each sector’s share of output and employment as an economy develops. India moved directly from agriculture to services, without a long manufacturing-led phase.
| Sector share of GVA (current prices) | 2022-23 | 2025-26 (PE) |
|---|---|---|
| Primary | 22.0% | 20.1% |
| Secondary | 26.0% | 25.9% |
| Tertiary (services) | 52.0% | 54.0% |
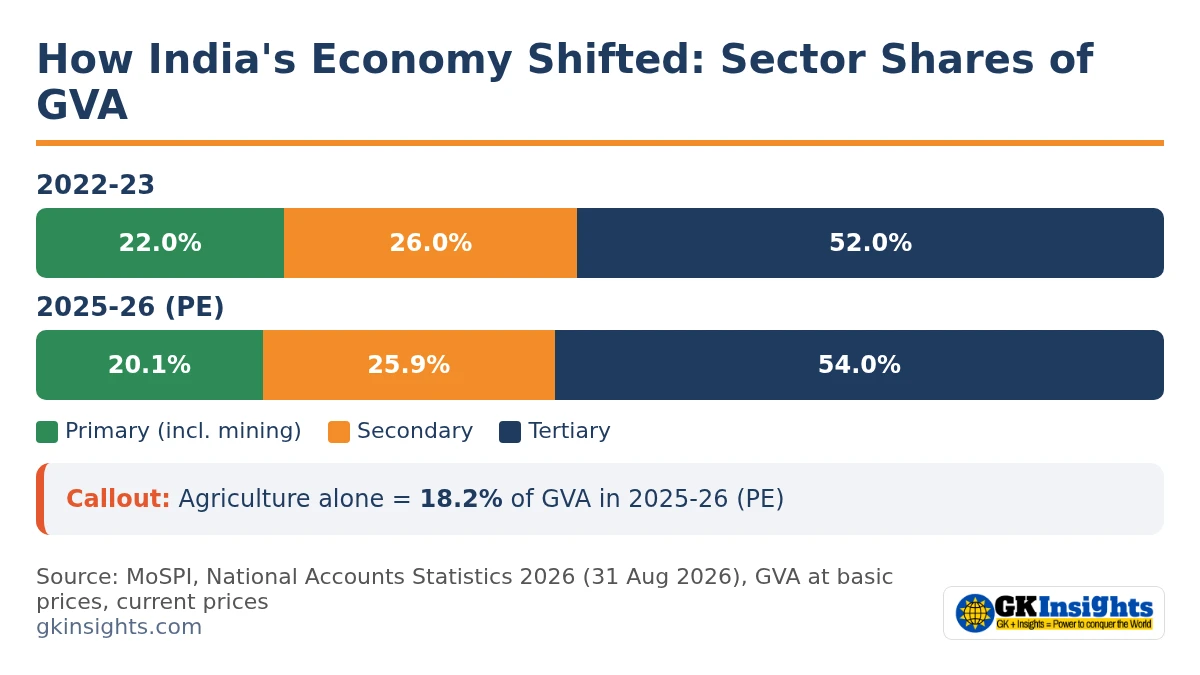
Calculated from MoSPI, National Accounts Statistics 2026 (31 August 2026), Statement 8.17.2 (GVA at basic prices, current prices). Primary = agriculture, livestock, forestry & fishing plus mining & quarrying. Agriculture, livestock, forestry & fishing alone made up 18.2% of GVA in 2025-26 (PE).
Drivers
- Rising incomes, which push up demand for services
- Growth of IT, telecom, finance and trade
- Reforms and global integration
- Technology and digitisation
Concerns
- Low output per worker in agriculture
- Manufacturing’s share is fairly flat, which limits job creation (hence Make in India)
Quick revision
- Overview of Indian Economy: India is a mixed economy, state-led until 1991 and market-oriented since.
- Pre-British: self-sufficient villages, famous crafts, active trade.
- Colonial impact: de-industrialisation, commercialisation of agriculture, drain of wealth.
- 1991: BoP crisis, then LPG reforms.
- After 2008: GFC, IBC, GST, inflation targeting, COVID and recovery.
- Latest: 7.8% real GDP growth in 2025-26 (PE). Services make up 54.0% of GVA.
Test yourself: 5 MCQs
“Recalled topic” means candidates reported this topic after the JAIIB exam on the date shown. The wording and options are ours. “Practice” questions are written by GK Insights.